Down the Drain campaign: Research and Evidence

In August 2022, we launched our Down the Drain campaign to raise awareness of the damaging effect of drink waste.
Like all of our work, the campaign was informed by environmental evidence and analysis.
£1.4 billion worth of drinks are poured down the sink by UK households every year
Share on
Where are the campaign statistics from?
The statistics which informed and are featured in the campaign come from or are based on the research of WRAP, Defra, High Tide Media, and Zero Waste Scotland.
24% of the total Scottish household waste was waste to sewer. [1]
44% of waste to sewer in Scotland is drink. [2]
11% (62,769 tonnes of the 595,229 tonnes) of total Scottish food waste was from drink waste. [3]
6% of alcoholic drinks are wasted. [4]
£1.4 billion of drinks is disposed of each year by UK households. [5]
Approximately 4.6 million tonnes of CO2 equivalent greenhouse gas emissions are released as a result of the avoidable (i.e. edible) food and drink disposed via the sewer by UK households. [6]
Individual item facts
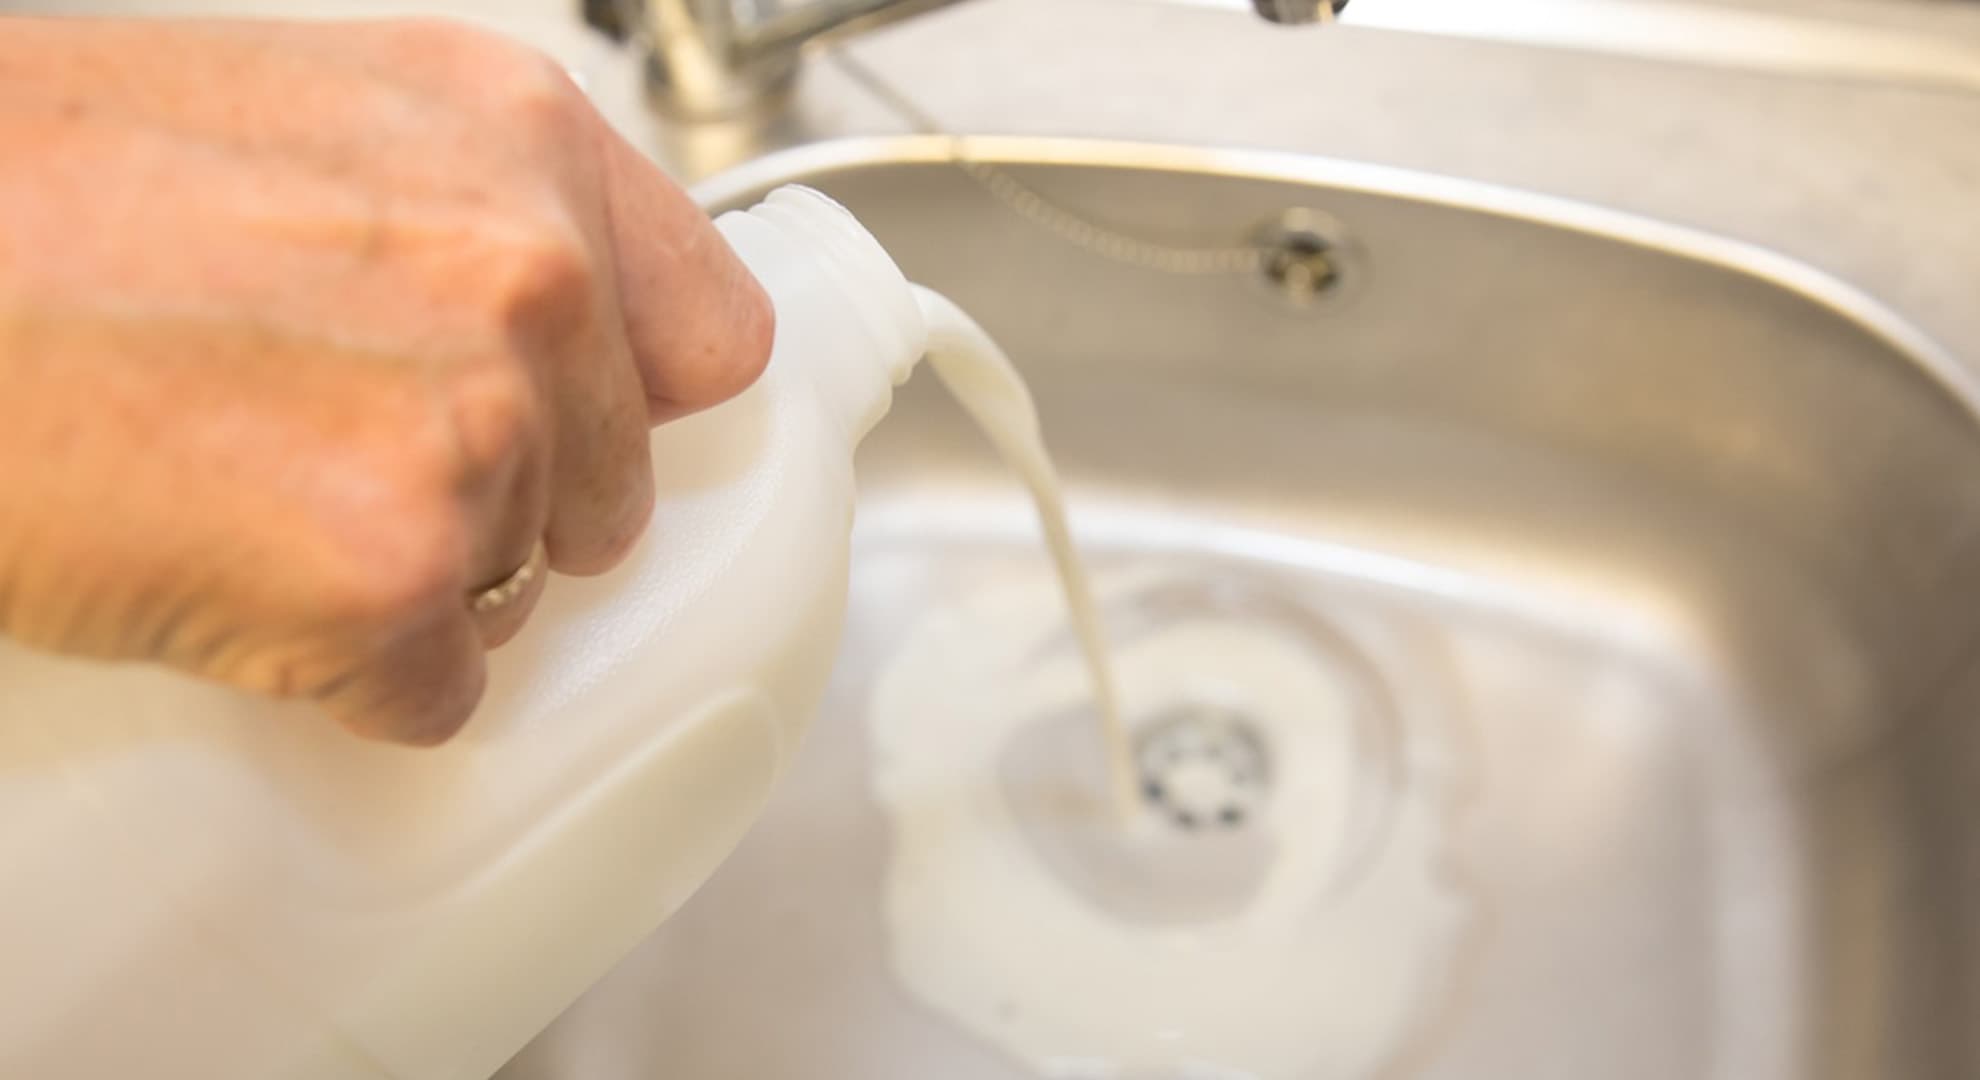
- Milk is the greatest single food type, at 330,000 tonnes per year, poured down the sink and drain by households. [7]
- 240,000 tonnes of carbonated soft drinks are also disposed of via household drains and again all of this waste could be avoided. [8]
- The total spending by UK households on fruit juice and smoothies that go to waste via the sink and sewer each year is £160 million. [9]
- Lager, beer, and cider have been grouped together and as such form the type of alcoholic drink thrown away in the greatest quantity. On almost all occasions, these drinks are poured away following too much being served or from cans being opened but not finished. [10]
- Wine is the costliest drink poured down the sink...the overall cost of pouring it down the sink to the householder is high at £470 million per year. [11]
- Approximately 66,000 tonnes of tea waste, made up of milk and sugar, are poured away by UK households after too much has been made. [12]
- A large proportion of householders claimed to 'never' dispose of each type of food and drink listed. This was particularly the case for alcoholic drinks and bottled water where over 80% of respondents claimed to never pour them away via the sink. [13]
- Overall householders tended to feel that disposal of liquids, particularly drink, via the sink is not a problem. There was a belief in general, that it is better to dispose of liquids via the sewage system than to put them in the household bin. [14]
- Pint of beer (568ml per serving) = 496 gCO2e = 3 slices of margarita pizza. [15]
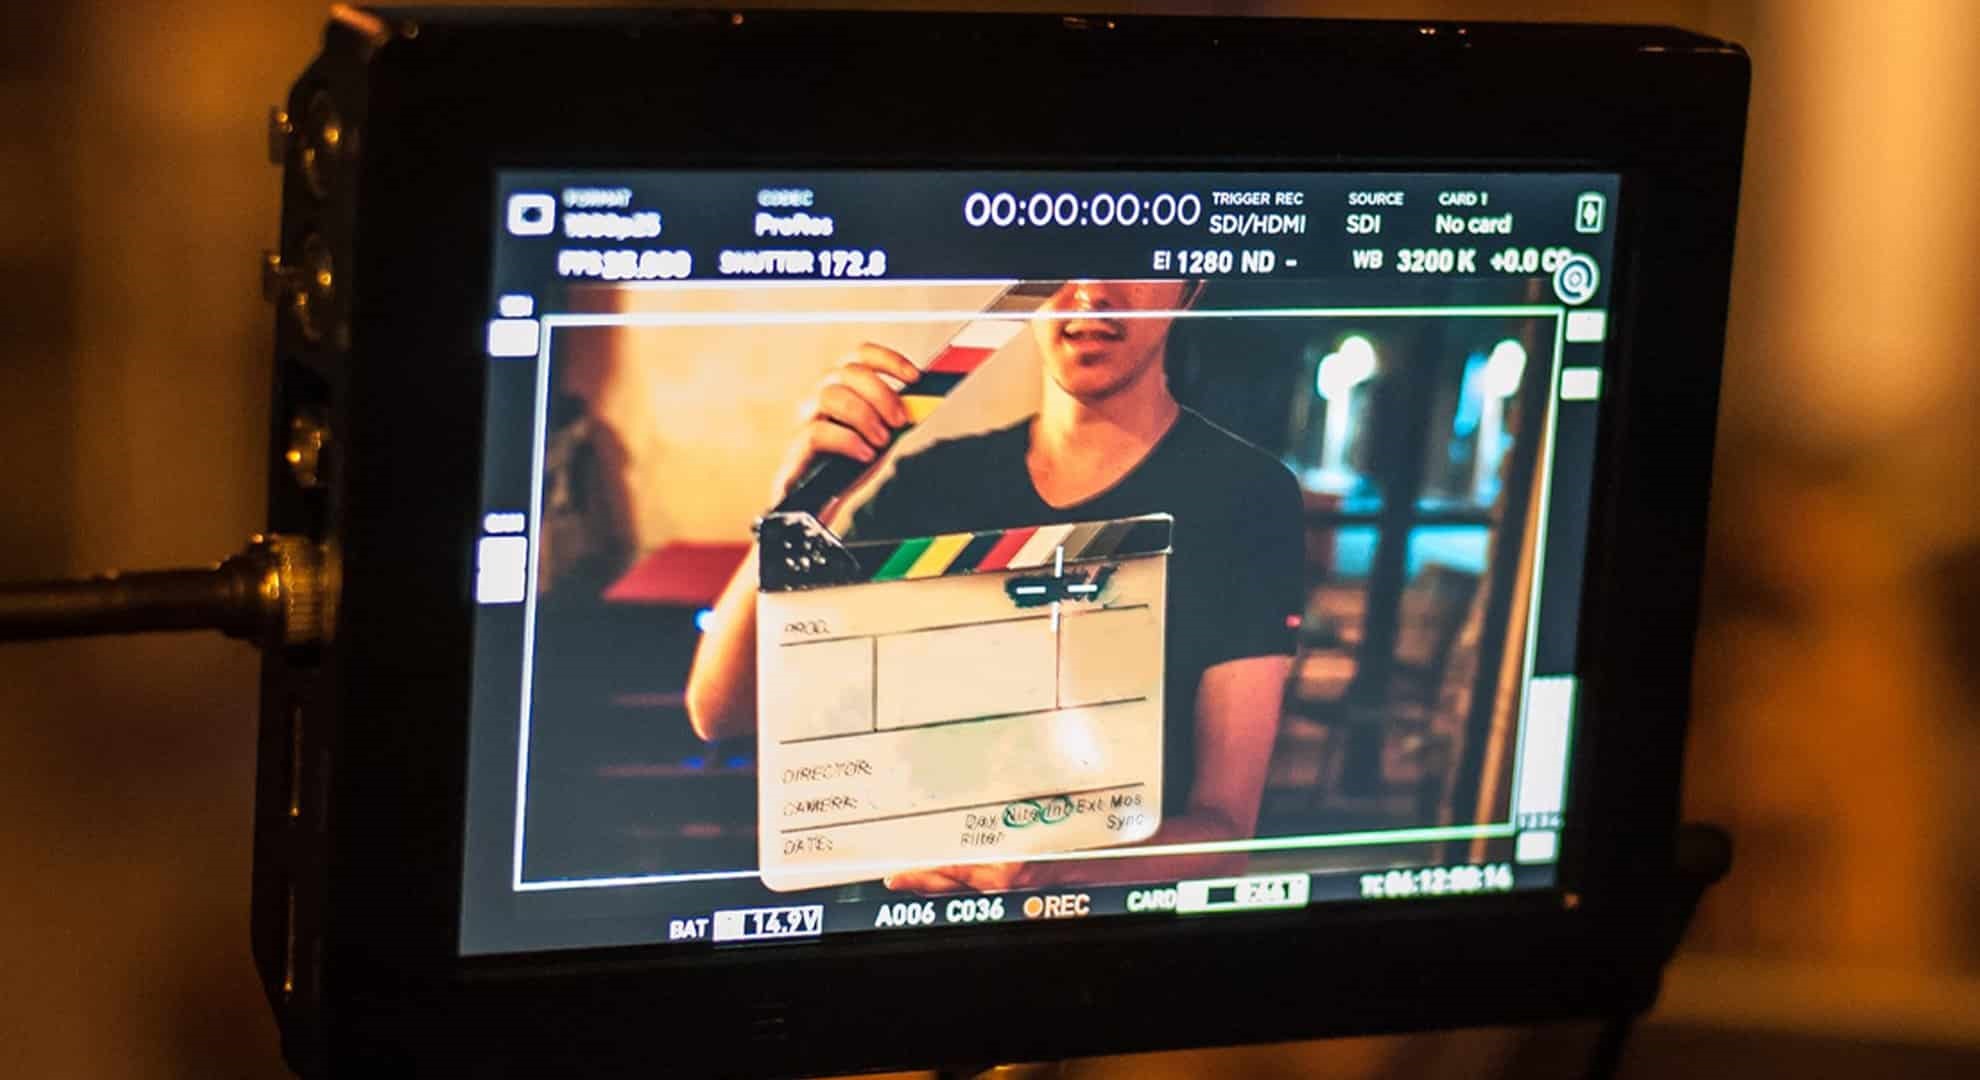
Film production
- The carbon footprint created during the making of our campaign film was 48% lower than the same shoot, had we not considered environmental factors. [16]
- Had we not taken steps to reduce our carbon footprint, we estimate we would have created 1004kg of CO2. This is the equivalent of driving from Thurso to Helsinki (via mainland Europe). Overall, we estimate that we reduced our carbon footprint by 489kg (or 48%). This is the equivalent of 1630 pints of locally brewed cask beer. [17]
- There was zero drink waste during this production. All drink that was poured out of customers' cups was given back to them after the prank had been revealed. [18]
- By eliminating our drink waste, we saved 12.8kg of Co2, which is the equivalent of 32 portions of spaghetti bolognese. [19]
How were the campaign's statistics gathered?
The research carried out to establish food and drink waste disposed of via the sewerage system focussed exclusively on waste from UK households, and items disposed of using the sink, toilet and drain, at home.
A diary-keeping methodology was used to collect the data, and the nature of food or drink disposed on each occasion recorded with a reason for disposal. Subsequent analysis converted volumetric quantities to weights and broke down the results to show whether food and drink waste could be classed as unavoidable (e.g. coffee grounds) or could have been avoided if consumers had managed it differently (e.g. froze their milk), the quantities of waste disposal with and without water added in the home as a part of preparation, and to convert units to monetary value in terms of cost to the consumer.
The environmental impact of the production, distribution, and storage in the home of food and drink was also considered. household recording, in these cases, the food waste that they generate, including the type, the amount (weight or volume), and reason for disposal.
Questionnaires were administered to participating households before and after the diary-keeping exercise. The questionnaires were designed to capture attitudes and perceptions among the participants related to food and drink waste and disposing of it generally, as well as specifically the use of the sink, toilet and outside drain as means to dispose of food and drink waste. Participants’ perceptions of their own food waste behaviour were asked before the exercise as well as questions about the desirability and necessity of using the sink as a means to pour away drinks and liquid food waste. The post-diary questionnaire asked participants whether their views of the amounts that they dispose in this way had changed during the week. It was also used to check whether the week had been broadly typical, as a way of checking that results were reliable.
The sample size for the purpose of this project was chosen to achieve a balance between the interests of precision in being able to report the results and the cost involved in delivering research of this labour-intensive nature. A 95% confidence interval was calculated for the mean waste per household per week for each food group and each waste type, based on quantities being disposed by all participants. The number of households disposing of each food group and type was also computed as a measure of the commonness of each when being disposed.
During the diary-keeping exercise, respondents were asked to record as much detail as possible on the items that they were disposing. This included information such as the brand of the items so that cost estimates could be as accurate as possible. Where possible, therefore, average prices from a variety of supermarkets for each item of a particular brand were applied to the quantity reported to have been disposed. Where items were recorded without a brand being specified, an average price list was compiled. This was done by producing a list of different brands across a range (from more to less expensive) for that type of food and taking the average from the items on the list.
The methodology for calculating the greenhouse gas emissions associated with food and drink waste cover the relevant elements of the life-cycle of food and drink including agriculture, manufacture, packaging, distribution, retail, transport to the home, storage and preparation in the home and waste disposal. [20]
Why was the sustainability report produced?
Digital storytelling plays a crucial role in tackling climate change. By reaching millions of people every day, online content is one of the most powerful tools out there for getting environmental messages across. However, UK film, TV and commercial productions produce thousands of tonnes of CO2 every year through travel, energy consumption, catering, props, costume and single use plastic.
The report was created by sustainability consultant Libby Penman (holder of ambassadorship by BAFTA Albert). This was about using data to understand what elements of a production have a negative impact on the environment, treating the environmental decisions as equal to budget and creative decisions, reducing our footprint wherever possible, and offsetting any impact we do have. Finally, any learning is taken forward into future productions and knowledge is shared with clients, agencies, and creative suppliers. [21]
What was measured?
- Filming spaces
- Travel and transport
- Food and catering
- Material consumption (print-outs, batteries etc)
- Non filming spaces (pre-production and editing)
- Drink waste
Has this report been checked for authenticity?
Yes, the report was audited by BAFTA Albert. Founded in 2011, Albert supports the global Film and TV industry to reduce the environmental impacts of production and create content that supports a vision for a sustainable future. [22]
- [1] Household food and drink waste in Scotland 2014 report, prepared by
- [2] Household Food and Drink Waste in the United Kingdom 2012, prepared by WRAP, Autumn 2013
- [3] Prepared by:
- [4] Household Food and Drink Waste linked to Food and Drink Purchases, prepared by: Department for Environment, Food and Rural Affairs, Summer 2010
- [5] Down the drain: Quantification and exploration of food and drink waste disposed of to the sewer by households in the UK, prepared by WRAP, Autumn 2009
- [6] Down the drain: Quantification and exploration of food and drink waste disposed of to the sewer by households in the UK, prepared by WRAP, Autumn 2009
- [7] Down the drain: Quantification and exploration of food and drink waste disposed of to the sewer by households in the UK, prepared by WRAP, Autumn 2009
- [8] Down the drain: Quantification and exploration of food and drink waste disposed of to the sewer by households in the UK, prepared by WRAP, Autumn 2009
- [9] Down the drain: Quantification and exploration of food and drink waste disposed of to the sewer by households in the UK, prepared by WRAP, Autumn 2009
- [10] Down the drain: Quantification and exploration of food and drink waste disposed of to the sewer by households in the UK, prepared by WRAP, Autumn 2009
- [11] Down the drain: Quantification and exploration of food and drink waste disposed of to the sewer by households in the UK, prepared by WRAP, Autumn 2009
- [12] Down the drain: Quantification and exploration of food and drink waste disposed of to the sewer by households in the UK, prepared by WRAP, Autumn 2009
- [13] Down the drain: Quantification and exploration of food and drink waste disposed of to the sewer by households in the UK, prepared by WRAP, Autumn 2009
- [14] Down the drain: Quantification and exploration of food and drink waste disposed of to the sewer by households in the UK, prepared by WRAP, Autumn 2009
- [15] Food Carbon Footprint Calculator, My Emissions
- [16] Down the Drain Production Sustainability Report, prepared by High Tide Media, Summer 2022
- [17] Down the Drain Production Sustainability Report, prepared by High Tide Media, Summer 2022 & How Bad are Bananas?: The Carbon Footprint of Everything, Mike Berners-Lee, Spring 2010
- [18] Down the Drain Production Sustainability Report, prepared by High Tide Media, Summer 2022
- [19] Down the Drain Production Sustainability Report, prepared by High Tide Media, Summer 2022 & How Bad are Bananas?: The Carbon Footprint of Everything, by Mike Berners-Lee, Spring 2010
- [20] Down the Drain: Quantification and exploration of food and drink waste disposed of to the sewer by households in the UK, prepared by WRAP, Autumn 2009
- [21] Down the Drain Production Sustainability Report, prepared by High Tide Media, Summer 2022